If the heat is permanently switched off, flies of both test groups keep
their orientation preference towards the previously 'cold' pattern orientation
for at least several minutes (Fig. 18). In the operant groups there was
no significant difference at t1 (the first two periods, p=0.911),
but the test group showed a significantly higher preference than the control
group (p<0.001) at t2 (the last two periods).
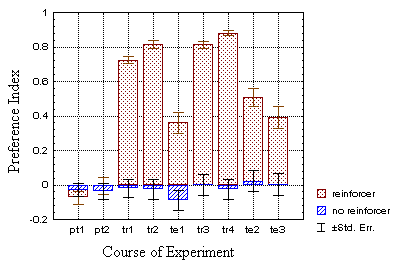
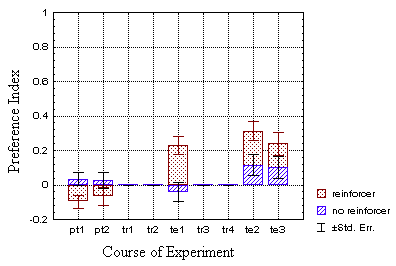
A
B Fig. 18: Mean preference indices for all four
groups of flies (N=100 each). Drosophila learns to avoid one of
the pattern orientations, if it was reinforced during the training periods
(dotted bars). The control group, which did not receive any reinforcement
only showed random avoidance (hatched bars). A - preference
indices of the standard groups, B - preference indices of the classical
groups.
Even if a repeated measures MANOVA revealed a significant difference
(p<0.03) in preference at t1 (the first two periods) for
the classical groups, the same analysis for all four groups (p=0.104) indicates
that the sample flies were indeed drawn from the same population. Furthermore,
the difference in avoidance was of the opposite sign than that at t2
(the last two periods, p<0.027).
Comparing the t2 preference indices of the operant with the
classical test group, the 'classical' index is significantly lower than
the operant one (p<0.015; p>0.22 for the control groups). However,
when the mean preference index at t1 is subtracted from the
indices at t2 (to compensate for the initial individual pattern
preference, see conclusion) the effect drops below significance (p=0.091).
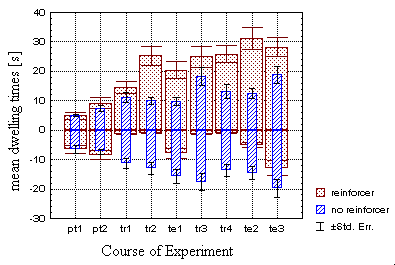
In contrast to Dill et al. (1995), a comparison of the mean dwelling times
(periods of staying in one quadrant) for the 'hot' and the 'cold' sectors
with the respective spontaneous behavior reveals that the operantly trained
flies modulate the average time they spend both in the 'hot' and in the
'cold' sectors, even during the last two periods (p<0.001 in both cases
of the operant groups, Fig. 19A). This can also be seen in the mean spike
amplitude in the different sectors and for spike timing, respectively (data
not shown). Dill et al. (1995) had found that "the dwelling times
in heat associated quadrants during test" were not significantly different
from the control group by comparing averaged individual medians (not means
as in this study) for each group. Since the frequency distributions of
'hot' and 'cold' dwelling times are very similar (Reinhard Wolf, pers.
comm.), the contradiction is considered not to be a statistical artifact.
Rather the omission of dwelling times shorter than 1s in Dill et al. (1995)
might have had an influence on the significance of the 'hot' effect: they
might pull the mean 'hot' dwelling times significantly below control levels
in this study. However, since comparing in a similar manner several of
the variables discussed in detail below (3.5.2), produced lasting effects
in the 'hot' sectors as well (data not shown), including the short dwelling
times was probably the right choice.
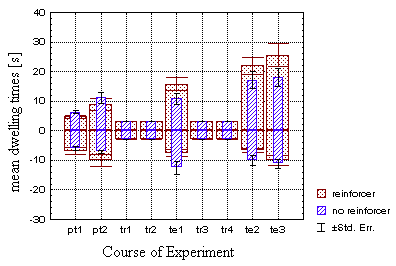
A
B Fig. 19: Comparison of mean dwelling times for
'hot' and 'cold' sectors (N=100 flies in each group). Individual mean dwelling
times were averaged for each group (wide,dotted bars: test
group, narrow,hatched bars: control group). Negative sign
indicates dwelling times in the reinforcer-associated quadrants. A - Standard
groups, B - Classical groups.
Classically trained flies (Fig. 19B) also change the time they spent
in one quadrant in response to the training, however to a lesser degree.
Comparing the classical test and control group at t2 (periods
8 and 9), the differences fail to rise above the significance level. Only
comparing the 'hot' dwelling times at all three test periods yields a significant
difference (p<0.04). Surprisingly, the 'cold' dwelling times, which
subjectively seem to reveal a larger difference can still not be distinguished
statistically using a repeated measures MANOVA over all three test periods
(p=0.10).