Attention-Like Deficit and Hyperactivity in a Drosophila Memory Mutant
1Queensland Brain Institute, The University of Queensland, Brisbane, Queensland 4072, Australia
2Institut für Biologie-Neurobiologie, Freie Universität Berlin, D-14195 Berlin, Germany
Correspondence should be addressed to Bruno van Swinderen, Queensland Brain Institute, The University of Queensland, Brisbane, Queensland 4072, Australia. b.vanswinderen@uq.edu.au
Abstract
The primary function of a brain is to produce adaptive behavioral choices by selecting the right action at the right time. In humans, attention determines action selection as well as memory formation, whereas memories also guide which external stimuli should be attended to (Chun and Turk-Browne, 2007). The complex codependence of attention, memory, and action selection makes approaching the neurobiological basis of these interactions difficult in higher animals. Therefore, a successful reductionist approach is to turn to simpler systems for unraveling such complex biological problems. In a constantly changing environment, even simple animals have evolved attention-like processes to effectively filter incoming sensory stimuli. These processes can be studied in the fruit fly, Drosophila melanogaster, by a variety of behavioral and electrophysiological techniques. Recent work has shown that mutations affecting olfactory memory formation in Drosophila also produce distinct defects in visual attention-like behavior (van Swinderen, 2007; van Swinderen et al., 2009). In this study, we extend those results to describe visual attention-like defects in the Drosophila memory consolidation mutant radish1. In both behavioral and brain-recording assays, radish mutant flies consistently displayed responses characteristic of a reduced attention span, with more frequent perceptual alternations and more random behavior compared with wild-type flies. Some attention-like defects were successfully rescued by administering a drug commonly used to treat attention-deficit hyperactivity disorder in humans, methylphenidate. Our results suggest that a balance between persistence and flexibility is crucial for adaptive action selection in flies and that this balance requires radish gene function.
Introduction
The fruit fly Drosophila melanogaster has been used for >30 years as a model system to study behavior in general (Vosshall, 2007) and learning and memory specifically (Keene and Waddell, 2007). More recently, investigations relating memory defects to attention-like processes have been initiated (van Swinderen, 2005, 2007; van Swinderen et al., 2009). Numerous Drosophila mutants defective in various aspects of memory formation represent a promising starting point to study the interactions between attention-like processes, memory, and action selection. For instance, a mutant might fail to show learning because it might not attend appropriately to relevant stimuli during memory formation, consolidation, or retrieval. Attention-like processes can be measured by the suppression of a competing stimulus, and such suppression effects should display quantifiable alternation dynamics that are reflected in the ongoing behavior of an animal. To provide insight into attention in animals, one approach is to measure short-term behavioral processes during perceptual tasks. However, short-term processes are rarely characterized in Drosophila learning mutants, for example, in which often a single population performance index may conceal informative defects in attention-like behavior. As a case in point, recent work has shown that the learning mutants dunce1 and rutabaga2080 appear to be less distracted by competing visual stimuli compared with wild-type flies, in both behavioral and electrophysiological paradigms (van Swinderen, 2007). Using a recently developed optomotor maze (van Swinderen and Flores, 2007), in which walking flies make successive turn choices in response to visual underlying moving gratings, dunce and rutabaga mutants were also found to display significantly greater optomotor responses in the maze than did wild-type flies, leading to the hypothesis that higher optomotor scores predict defective suppression mechanisms characteristic of attention (van Swinderen, 2007). Interestingly, the Drosophila radish1 mutation did not show a significant optomotor response in the maze under the same conditions that produced strong responses in dunce1 and rutabaga2080.
A gene involved in anesthesia-resistant memory (ARM) (Folkers et al., 1993; Tully et al., 1994; Folkers et al., 2006), radish has been suggested to define a separate pathway to memory formation distinct from dunce and rutabaga (Isabel et al., 2004). Considering the opposing optomotor phenotypes of radish1 and dunce1, a major question was raised: why do mutants defective in supposedly distinct odor memory consolidation pathways also show distinct visual behavior phenotypes in the optomotor maze? Because radish mutant flies are not blind (Gong et al., 1998), we hypothesized that the poor response of radish1 to visual stimuli in the maze results from defective short-term processes relevant to attention rather than from defects in vision per se. To address this question, we approached attention in radish1 and wild type by three different paradigms amenable to addressing short-term processes: individual choice behavior in the optomotor maze, torque behavior in the tethered flight arena, and brain activity in response to competing visual stimuli. In the process of characterizing radish mutant defects in our visual paradigms, we developed a simple approach for measuring “attention span” in fly brain activity.
We found that radish mutants are defective for a number of short-term processes relevant to selective attention. These include the following: altered optomotor responsiveness, reduced turn stereotypy, and increased distraction in a visual choice maze; periodic hyperactivity and reduced fixation time in the tethered flight arena; and less sustained response dynamics as measured by local field potential (LFP) recordings in the brain.
Materials and Methods
D. melanogaster strains and stocks.
Flies were cultured at 22°C, with 50–60% humidity, on a 12 h light/dark cycle on standard media. Wild-type flies are from the Canton S strain; the radish1 mutant, learning and memory mutants, and select Gal4 and upstream activating sequence (UAS) strains were obtained from the Bloomington Drosophila Stock Center. Targeted expression of the tetanus toxin light chain (tnt) or the ether-a-gogo (eag) mutation was produced by crossing a strain homozygous for insertions of UAS–tnt on the X chromosome (wz,P{w+mC = UAS–TeTxLC}) or the strain wz; P{w+mC = UAS–eagΔ932}/Cyo to the strain Th–Gal4-3 (w1118; P{w+mC = UAS–TH-3}, a tyrosine hydroxylase construct on the third chromosome). The hs–rsh(161) strain (Folkers et al., 2006) was obtained from Scott Waddell (University of Massachusetts, Worcester, MA). Only 2- to 7-d-old female flies were phenotyped, 1 d after having been anesthetized with cold air (flight arena and electrophysiology) or CO2.
Optomotor maze and population responses.
The maze, described previously (van Swinderen and Flores, 2007), consists of 3-mm-wide paths grooved into a 28 × 19 × 1 cm acrylic slab placed groove-face down on a glass plate to form a closed horizontal choice platform. The platform was positioned 3 cm above an up-ended 19-inch flat-screen computer monitor (Mitsubishi Diamondpro 930), on which was displayed a green/black grating of 1 cm spatial resolution, moving at 3 Hz (or other frequencies, as specified). The maze was surrounded by a white box (a 30 × 50 × 30 cm container), unless specified otherwise, with an aperture directly above for filming. Flies collected by CO2 anesthesia the day before an experiment were loaded (n = 25–30) into modified, disposable polyethylene “jumbo” transfer pipettes (Fisher Scientific), in which they were allowed to acclimatize 3 min in the dark before the pipette was inserted into to the starting position of the maze. After running the choice maze (2–5 min) in a darkened room, the flies' distribution among the nine collection tubes was scored as a weighted average ranging from −4 to +4. The optomotor index (OI) is the deviation of the weighted average from 0, the middle tube, in which positive scores indicate optomotor responses in the same direction of image motion. All statistics were t tests of experimental means, unless otherwise specified. Visual stimuli presented to flies running the maze were exactly as described previously (van Swinderen and Flores, 2007): 1 cm green/black gratings moving at 3 Hz (or other frequencies, as specified). For distraction experiments, we followed two distinct paradigms. We modified a paradigm described previously (van Swinderen and Flores, 2007) involving static cardboard bars presented to either side of the maze. Because this paradigm did not allow for efficient calibration of the distracter, we developed a more flexible paradigm, featuring liquid crystal display (LCD) monitors, one on either side of the maze. The LCD monitors were ∼10 cm from each side of the maze, facing each other. The LCDs displayed a 25 × 5 cm white vertical bar on a red background; the bar was placed only on the LCD that was on the side opposite optomotor flow on the cathode ray tube (CRT) (with the other LCD displaying only red). The percentage of background red in the white bar was gradually increased (from 0 to 100%) to measure the distractive effects of the bar on the optomotor response. Phototaxic responses to the distracter alone were also tested, and fly distributions in the maze were quantified the same way as for optomotor experiments. In a second distraction paradigm, we tested flies' optomotor responses to competing objects (fields of 1 cm blue squares or green circles) moving in opposing directions on the CRT beneath the maze.
Individual fly responses in the maze.
Playback from filmed experiments allowed individual fly choice behavior in the maze to be quantified. For a detailed analysis of optomotor behavior, the path followed by the first 10 flies to complete the maze was manually traced onto a template of the maze (n = 40 per experiment, distributed among four separate mazes). At each of the eight successive choice points, the number of flies making “positive” or “negative” turns was tallied, providing a probability statistic for turns at each level. Occasionally, flies reversed direction, and these events were tallied as well according to the choice level where they occurred.
The number of consecutive turns in the same direction, before turning to the alternate direction or reversing, was tallied per fly as well, yielding a choice persistence index. Each fly could make a number of consecutive turns in either direction, up to a maximum of eight consecutive turns (which would necessarily position it in tubes −4 or +4). These data were summed for 10 flies per maze (40 in total) and averaged for a genotype. A weighted average of these eight possible categories was calculated for either direction (total 1 turn * 1 + total 2 turns * 2 +…+ total 8 turns*8), yielding a measure of choice persistence, which was normalized by the total number of turns. Perfect alternation behavior would thus yield a score of 1, random behavior would yield a score of 1.9 [based on a random model produced in MATLAB (MathWorks); data not shown], and significantly greater persistence scores indicate consistent turns in the same direction (stereotypy). In all of our individual fly analyses, we only quantified the behavior of the first 10 flies to complete each maze run.
Turning behavior in the flight arena.
Flies were tethered as described previously (Maye et al., 2007) and tested the following day for flight behavior (for a video of the procedure, see Brembs, 2008). The duration of the experiments had to be confined to 6 min because radish mutants were reluctant to fly continuously in the arena. For the same reason, in some experiments [notably, for hs-rsh(161)], the number of animals is comparatively low. A featureless cylindrical arena was used to test baseline torque dynamics during uninterrupted 6 min flights, sampled at 20 Hz. In the closed-loop scenario, the setup was identical except that two pairs of opposing visual objects (upright and inverted Ts) were placed in the center of the four quadrants on the arena wall, and the speed of arena rotation was made inversely proportional to the yaw torque signal of the fly (Dill et al., 1993; Brembs and Heisenberg, 2000, 2001). Median fixation time for each strain was determined by durations of uninterrupted flight orientations centered on each of four 70° wedges (centered on each object).
Activation of wild-type radish.
A wild-type radish transcript under the control of a heat-shock promotor, rsh(161) (Folkers et al., 2006), was activated in a radish mutant background by exposing flies (late-stage pupae or third-instar larvae) to 37° for 5 h.
Electrophysiology.
Brain recordings were performed exactly as described previously (Nitz et al., 2002; van Swinderen, 2007). The recording site was 50–75 μm down from the center of the ocelli, with a reference electrode 100 μm into the top of the left eye. The recording is thus a voltage differential between these two sites, probably representing field effects produced by populations of mushroom body (MB) neurons near the central electrode (van Swinderen et al., 2009). Spectral analyses of brain activity data were performed in MATLAB by Fourier analysis of 24 overlapping sectors of the 360° rotating panorama. To determine significant selection/suppression of visual objects, we contrasted (by t test) the power of a bandpass-filtered signal for the six sectors (of 24 total) comprising one object (e.g., the cross in front of the fly) versus the six sectors comprising the opposing object (e.g., the square in front). A visual explanation of our responsiveness calculations is shown in supplemental Methods 1 (available at www.jneurosci.org as supplemental material). To determine alternation dynamics of 20–30 Hz activity in the ongoing attention paradigm, we calculated the log ratio of summed 20–30 Hz activity for successive 1.5 s epochs corresponding to either object sweeping in front of the fly. These ratios were then plotted to determine the duration of successively biased 20–30 Hz activity (in which activity was higher for one object for several cycles) until power alternated to the competing object. This duration is termed “alternation time” (AT). To quantify ongoing bias for either object, we summed AT values found within contiguous groups (“clumps”) >4 and flanked by AT scores of 1. AT data from different flies were combined for all flies within a genotype (generally, all flies within a genotype revealed a similar number of such clumps for 400 s experiments) and plotted as frequency histograms. To determine the significance of such AT clumping, we shuffled (by permutations in MATLAB) the original log ratio data such that the temporal aspect of the data was lost, and then we recalculated AT values and resulting AT clump sizes. One thousand permutations of the data were performed to generate a frequency histogram for shuffled data. Significant differences between datasets was set at p < 0.05 and determined by the Kolmogorov–Smirnov test for distributions. A visual explanation of our “attention span” calculations is shown in supplemental Methods 2 (available at www.jneurosci.org as supplemental material).
Pharmacology.
Flies were treated with methylphenidate (MPH) (Sigma) mixing the drug (0.5 mg/ml) into regular fly food. Before feeding, flies were starved in empty vials for 2 h. Ingestion of the drug was confirmed by adding blue food coloring to the food and checking fly abdomens for blue color after feeding. Most flies had ingested drug-laced food by 3 h. Control flies were fed only blue food without drug. For electrophysiology experiments, tethered flies were provided with a morsel of the drug-laced food after ∼2 h starvation and observed to feed on it, with experiments starting 10 min to 1 h afterward. All flies prepared for electrophysiology were fed a morsel of food before testing in the arena, so these served as controls for the MPH-treated flies.
Results
Behavioral paradigms: optomotor maze
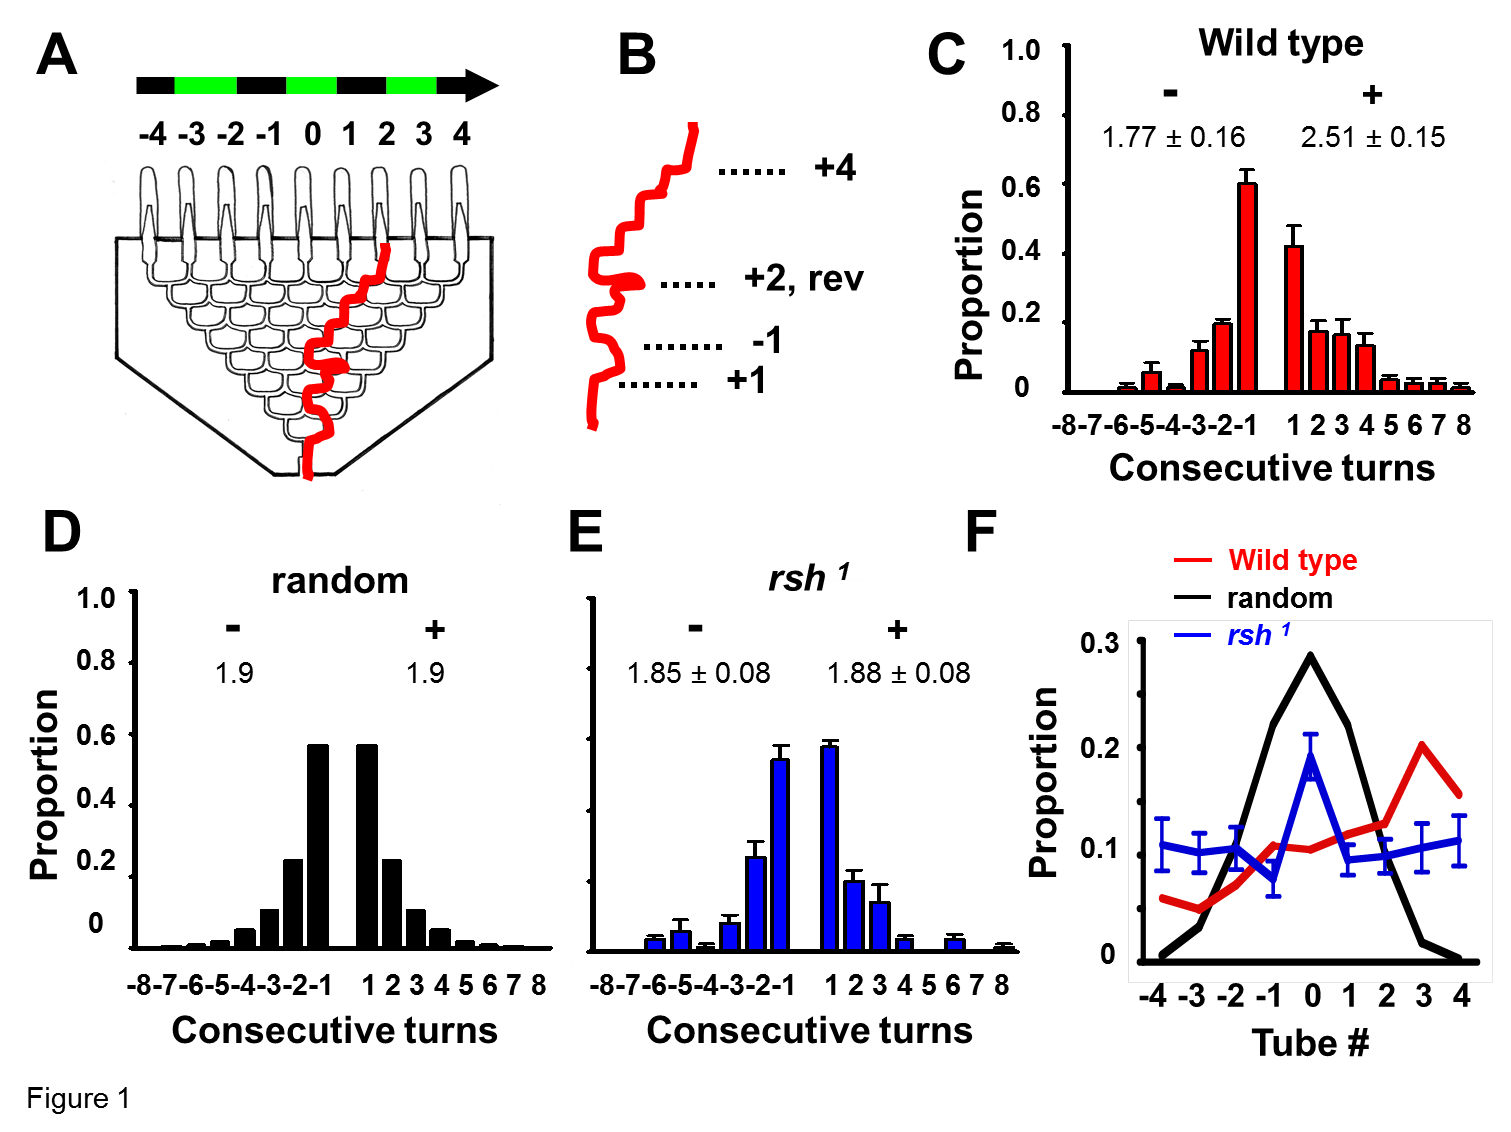
Wild-type flies respond to moving visual effects by turning in the direction of image motion (Heisenberg and Wolf, 1984) (an optomotor response, as measured by the OI; see Materials and Methods). In our optomotor maze paradigm, whereas wild-type Canton S flies display an average optomotor index of 0.75 ± 0.08, radish mutants showed diminished responsiveness to moving visuals in the maze (OI = 0.10 ± 0.12 for green/black 1 cm grating moving at 3 Hz; see Materials and Methods) (van Swinderen, 2007). Because this radish1 phenotype is not attributable to blindness [radish mutants can respond to visual objects in other conditions (Gong et al., 1998)], we wondered whether radish mutants might be characterized by distinct behavioral idiosyncrasies that interfered with choice behavior as they completed the maze. To measure short-term processes in the maze, we filmed and quantified individual behaviors as flies progressed through the eight-level choice maze (Fig. 1A). Turn stereotypy, defined as the average number of consecutive turns a fly made in the same direction (Fig. 1B) (see Materials and Methods), was tallied for 40 individuals. Wild-type flies display significant stereotypy in the direction of optomotor flow, making ∼2.5 consecutive turns in that direction compared with ∼1.8 consecutive turns against optomotor flow (Fig. 1C). This short-term hysteresis, or behavioral persistence, most likely contributes significantly to the positive optomotor score (van Swinderen and Flores, 2007). If turn behavior were random and independent across choice levels, one would see a symmetrical distribution resembling a binomial model, with ∼1.9 consecutive turns in the same direction (Fig. 1D). Interestingly, radish mutants behaved much like the binomial model, lacking any hysteresis across choice levels, with ∼1.9 consecutive turns either with or against optomotor flow (Fig. 1E). The even distribution of radish animals across the nine endpoints of the maze further suggested a defect in visual responsiveness in radish mutants (Fig. 1F).
Weak optomotor performance in the maze caused by the radish mutation was rescued by activating a wild-type radish transgene, hs-rsh(161), on a mutant radish background. Interestingly, rescue required prolonged (5 h) activation of the radish gene during development. The heat-shock regimen (see Materials and Methods) used previously (Folkers et al., 2006) to rescue radish1 for odor-learning defects in the adult was not sufficient for rescuing optomotor defects (before heat shock, OI = 0.09 ± 0.15; after heat shock, OI = 0.18 ± 0.14). However, radish transgene activation during the late pupal stage rescued optomotor responsiveness to our standard 3 Hz grating (OI = 0.55 ± 0.12), but activation during the third-instar larval stage did not (OI = 0.06 ± 0.4). The requirement of radish during development for normal optomotor responses resembles similar results found for dunce mutants (which display extremely high optomotor responsiveness) in which only dunce gene induction during development (but not adulthood) rescued dunce optomotor phenotypes (van Swinderen, 2007). Furthermore, dunce defects were also found to be rescued specifically at the late pupal stage (van Swinderen et al., 2009). These results suggest that wild-type optomotor responsiveness levels are dependent on cellular events that occur during a specific stage of brain development and that dunce [a cAMP phosphodiesterase (Davis, 2005)] and radish [a gene with no clear homology (Folkers et al., 2006)] may be required during the same pupal stage for the formation of circuits affecting optomotor responsiveness.
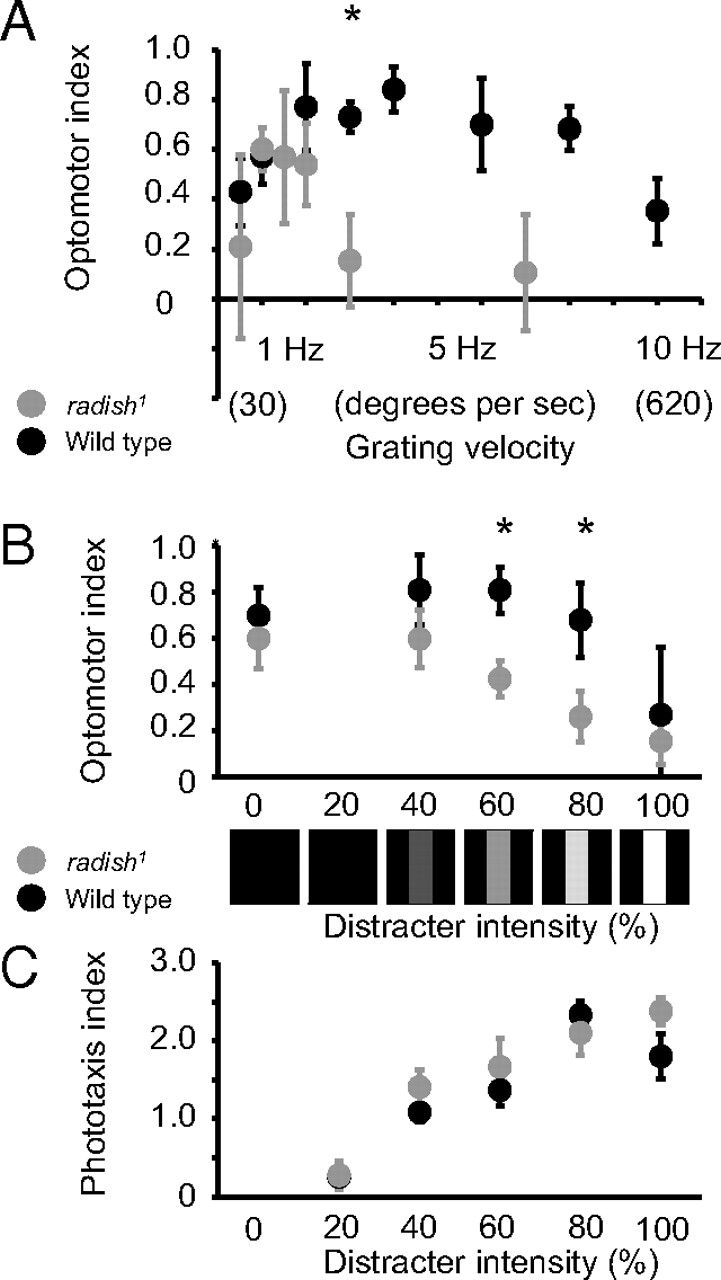
Radish mutants are not blind and respond to visual stimuli, as has been shown in other behavioral studies (Gong et al., 1998). Phototaxis appears to be normal in radish mutants when tested in response to a light source in our maze paradigm (OI = 2.4 ± 0.15 vs OI = 2.55 ± 0.08 for wild type). To fully explore whether radish1 responds at all to moving gratings, we exposed the mutants to different grating velocities. Wild-type flies typically display a velocity curve with decreased responsiveness at very low (<1 Hz) or very high (>10 Hz) grating velocities (Fig. 2A). We were surprised to find that radish mutants displayed a shifted velocity curve compared with wild type, with peak responsiveness at low (∼1 Hz) grating velocities but no response at 3 Hz (Fig. 2A), which is the grating velocity we used in our initial behavioral characterization (above). Although this shifted optomotor effect in radish1 requires additional explanation, the fact that radish1 does respond to slower moving gratings allowed us to test the mutant for distraction phenotypes.
Behavioral paradigms: distraction in the maze
Distraction can be measured by the loss of optomotor responsiveness to a moving grating caused by competing visual objects (van Swinderen and Flores, 2007). To test radish1 for distractibility, we used two different paradigms that presented competing objects in different ways. In the first paradigm, we modified a previously used method in which static bars presented to the side of the maze abolish optomotor responses to the moving grating displayed under the maze (van Swinderen and Flores, 2007). To better quantify distraction phenotypes, we replaced the static (cardboard) distracters of our previous paradigm with programmable displays on LCD screens and measured responsiveness to the grating in competition with increasingly salient distracters (see Materials and Methods). We found that radish mutants (responding to a 1 Hz grating) lost optomotor responsiveness at lower levels of distracter intensity than wild type (Fig. 2B), although responsiveness to the distracter alone was the same for radish1 and wild type (Fig. 2C).
To test the effect of distracting visuals in a different way, we presented them as competing moving objects on the CRT beneath the maze. Instead of the moving green/black grating, we displayed an intercalated field of green circles and blue squares moving slowly (∼1 Hz) in opposite directions (Fig. 3A). Wild-type fly populations presented with this conflicting scene display a “U”-shaped distribution after completing the maze, suggesting that flies are following one or the other wide-field pattern for periods of time as they complete the maze (Fig. 3B, black line). In contrast, radish mutants display an “inverted U” distribution when presented with the competing optomotor stimuli (Fig. 3B, gray line). This suggests that, unlike wild type, radish1 individuals do not follow one or the other wide-field stimulus for enough time to bias final fly distributions in the maze. radish1 flies are nevertheless responsive to each wide-field stimulus presented independently, as are wild type (Fig. 3C,D),

Together, results from our visual competition paradigms as well as from filmed experiments over moving gratings suggest that the behavioral defects of radish mutants pertain to short-term choice processes (e.g., increased distraction, random alternation dynamics, and attention-like deficits). To pursue this hypothesis, we further characterized short-term behavioral processes in radish mutants using an entirely different visual paradigm, the flight arena.
Behavioral paradigms: flight arena
Suspended at a torque meter, flies spontaneously initiate turning maneuvers by modulating their wing beat amplitudes, resulting in measurable torque effects around the fly's vertical body axis (yaw torque). We used the yaw torque signal to allow the flies to control the angular position of visual patterns on the arena wall (Heisenberg and Wolf, 1984). In such a feedback setup, flies are thus able to report ongoing decision-making by their choice of flight direction.
Further supporting the notion that radish mutant flies are not visually impaired, the mutants show an optomotor response in the flight arena and are able to stabilize the rotation of the visual patterns (i.e., fly straight). In our setup, we allowed the flies to choose between flying toward a pair of upright Ts and a pair of inverted Ts. Previous research has shown that radish mutants can distinguish and learn to associate these two patterns with aversive stimuli (Gong et al., 1998), but when we analyzed the flight recordings of naive animals, we discovered that wild-type flies spend longer time periods directly in front of the patterns compared with radish mutants. The median time spent by radish mutants fixating on either pattern was significantly less than wild type: only 1.3 s compared with 3.0 s for wild-type flies (p < 0.01 by Kruskal–Wallis nonparametric test for medians) (supplemental Fig. 1, available at www.jneurosci.org as supplemental material). We next analyzed the torque trace for any abnormalities that could explain this difference. Surprisingly, we found a strong ∼1.6 Hz peak (Fig. 4A, gray line) in the power spectrum of the radish1 torque trace, whereas wild-type flies controlling the same visual stimuli did not show such oscillatory hyperactivity in their torque behavior (Fig. 4A, black line) (for sample torque traces, see supplemental Fig. 2, available at www.jneurosci.org as supplemental material). A different variant of radish1, hs–rsh(161) (Folkers et al., 2006), also showed this peak (supplemental Fig. 3, available at www.jneurosci.org as supplemental material), firmly establishing the mutated radish gene, rather than the genetic background, as the cause of this oscillatory hyperactivity.
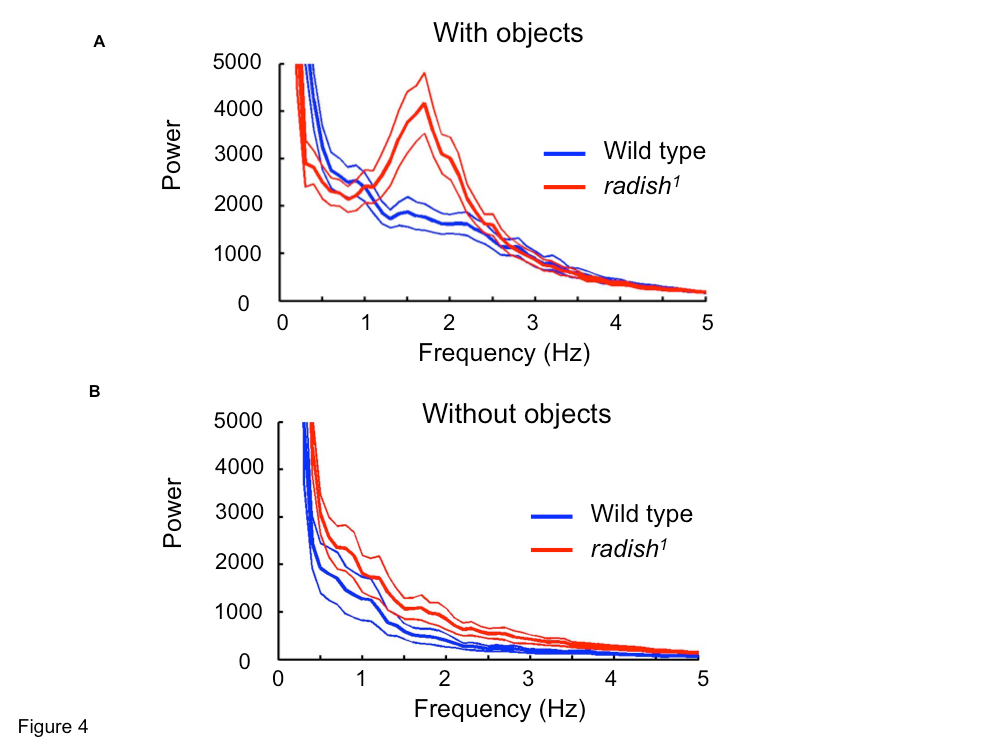
To study whether this “fidgety” phenotype was generated endogenously or induced by the visual patterns, we analyzed the torque traces of flies recorded in the absence of any patterns. Without feedback or visual stimuli (i.e., open loop), we found that turning behavior in radish mutants was still characterized by some hyperactivity between 1 and 2 Hz. However, in this situation, hyperactivity was not characterized by a single frequency peak, being instead more broadly distributed between 0.5 and 3 Hz (Fig. 4B, gray line). Wild-type torque behavior was again not strongly periodic without visual stimuli present (Fig. 4B, black line). These tethered flight data suggest that the presentation of competing visual stimuli induces oscillatory hyperactivity in radish mutants.
Brain recording paradigms: oscillations
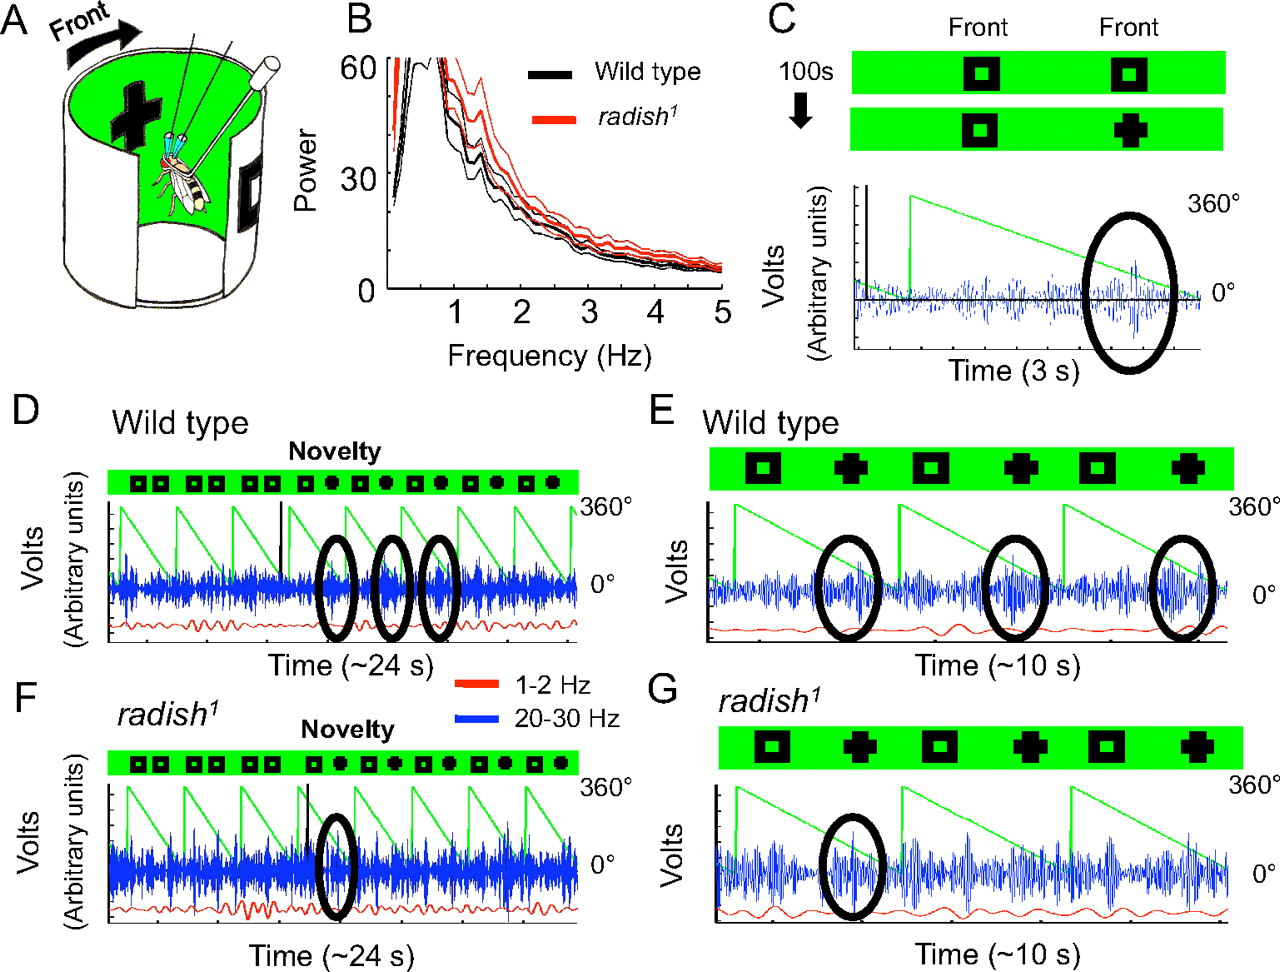
We were curious as to whether the flight hyperactivity of radish1 flies was indicative of more widespread activity effects in the brain. To determine this, we recorded LFPs using a tethered preparation that has been used previously to study brain activity in flies (Nitz et al., 2002). LFPs reflect the synchronous activity of populations of neurons, and these have been associated with visual (van Swinderen and Greenspan, 2003) as well as olfactory (Tanaka et al., 2009) stimuli in Drosophila. As in the flight arena, flies are tethered by their head and thorax but are free to move their legs and wings in this electrophysiology preparation (Fig. 5A). Two glass electrodes implanted into the brain and recording a voltage differential provide an ongoing measure of brain activity in the fly. Overall LFP activity in radish mutants was not significantly different from wild type, as evidenced by spectral analysis between 5 and 100 Hz (data not shown). However, when we explored low LFP frequency domains (0–5 Hz) in radish mutants exposed to visual stimuli (van Swinderen and Greenspan, 2003), we did notice increased LFP activity between 1 and 2 Hz in most radish flies compared with wild type (Fig. 5B), although this was not significant on average for our sample.
In our brain recording preparation, our animals are not flying, and therefore they are not engaged in the behavioral alternations that produce torques in the flight paradigm. To determine whether the 1–2 Hz effect in brain activity might still be attributable to behavioral twitches, we inserted an electrode in the thorax to record movement (van Swinderen et al., 2004). Comparison of raw traces of brain and thoracic activity in radish mutants revealed that the 1–2 Hz brain oscillations were often sinusoidal, whereas the thoracic potentials were mostly bursts of spike-like activity, not necessarily synchronized to the brain events (supplemental Fig. 4, available at www.jneurosci.org as supplemental material). The source of the 1–2 Hz oscillation remains unclear; it may be widespread across the mutant's nervous system, as evidenced by a minor peak at similar frequency range from the thorax recording (supplemental Fig. 4, available at www.jneurosci.org as supplemental material). A recent report has shown a similar ∼2 Hz flight effect in wild-type flies lacking flight experience (Hesselberg and Lehmann, 2009). Together with our data, this suggests that radish mutants might be behaving like inexperienced flies in tethered flight.
Brain recording paradigms: novelty detection
A more general explanation for the behavioral defects described so far for radish1 would suggest that these mutants have an “attention deficit.” To address attention-like processes in the brain of radish mutants, we recorded LFPs while presenting competing visual stimuli of variable salience. As described above, introducing competing visual objects to radish mutants in tethered flight resulted in a dramatically increased 1–2 Hz torque behavior, indicating that radish mutants are responding to the competing visuals by engaging in this strongly periodic behavior. Because the net consequence of this behavior is decreased time fixating either object (discussed above), this suggested an increased rate of perceptual alternations in radish mutants. We therefore proceeded to investigate brain responses to competing visual stimuli. Brain LFP activity in the 20–30 Hz range was shown previously to be associated with visual salience effects such as novelty, with wild-type flies showing a significant selection of visual novelty and simultaneous suppression of a competing non-novel object (van Swinderen and Greenspan, 2003; van Swinderen, 2007; van Swinderen et al., 2009). The learning and memory mutants dunce1 and rutabaga2080 are defective in their brain responses to visual novelty, and this is associated with increased optomotor behavior in the maze (van Swinderen, 2007). We probed whether brain LFP responses were also compromised in radish mutants because radish1 performed poorly in the optomotor maze, were more distractible, and attended more briefly to visual stimuli in tethered flight relative to wild type.
In our visual novelty paradigm, flies are exposed to two identical squares rotating 180° apart around the fly for 100 s, and then one of the squares is changed to a cross (Fig. 5C). To investigate brain responsiveness to visual novelty, we bandpass filtered the LFP signal at 20–30 Hz and correlated amplitude of that frequency band to either competing object on the rotating panorama (Fig. 5C) (for a visual explanation, see supplemental Methods 1, available at www.jneurosci.org as supplemental material). Wild-type flies display a sustained increase in 20–30 Hz activity associated with a novel visual object, often lasting three to four cycles of the rotating panorama (Fig. 5D,E). In contrast, radish mutants did not appear to display a sustained response to visual novelty in the brain-recording paradigm (Fig. 5F,G). Indeed, averaging data for multiple flies (n = 14) for the 10 s after a novelty transition suggested that radish mutants do not respond to visual novelty, for any LFP frequency domain between 10 and 40 Hz (Fig. 6A, left), whereas wild-type flies show a strong responsiveness to visual novelty (Fig. 6B, left) (van Swinderen, 2007).
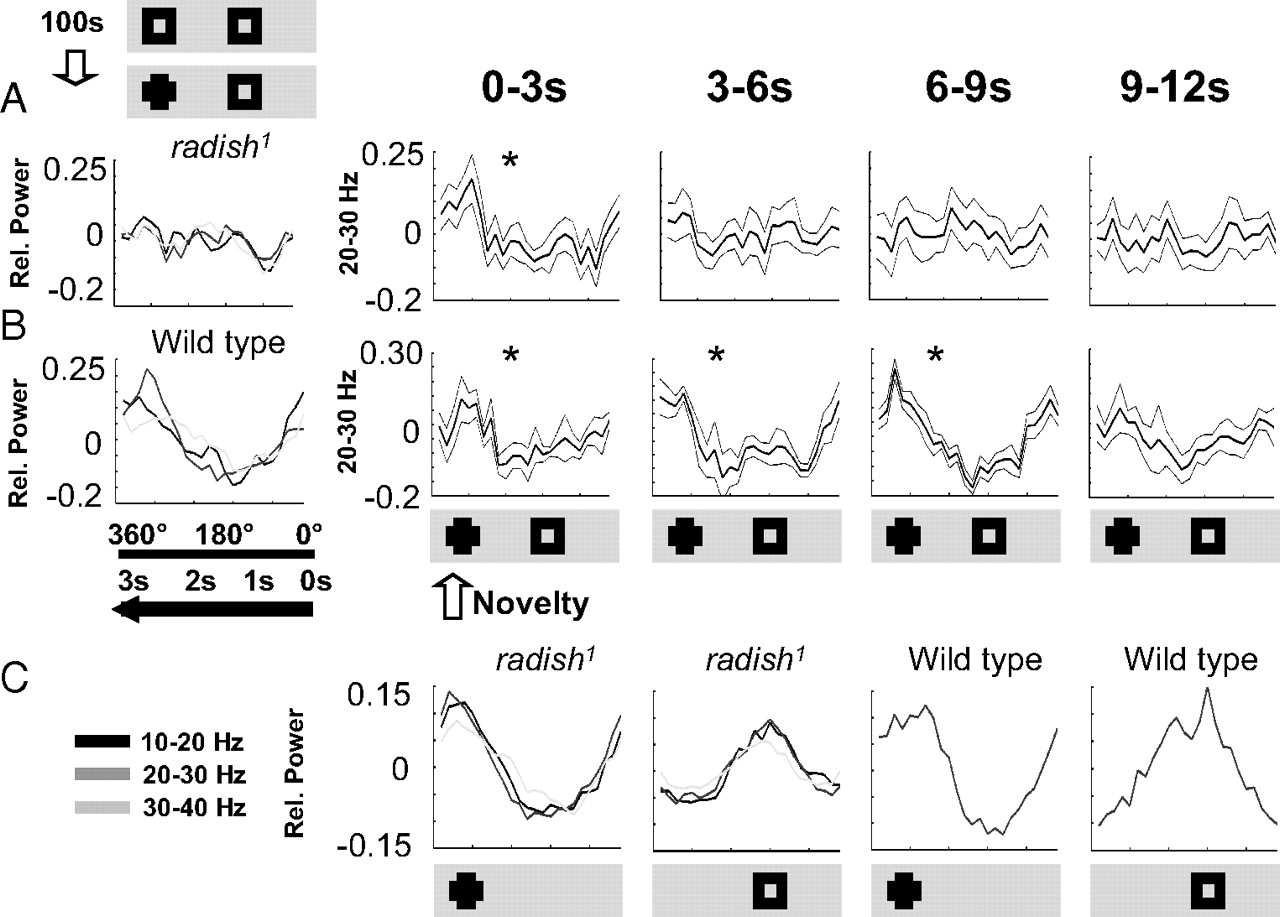
Closer observation of the LFP signal suggested differences in the temporal dynamics of 20–30 Hz responses in radish1 compared with wild type; the mutant appears to respond more often at various times of each panorama rotation without the suppression effects characteristic of wild-type flies (Fig. 5E,G). We wondered whether radish mutants might fail to detect novelty because of such defective attention-like dynamics, as also suggested by our behavioral experiments. To address this, we partitioned our data into successive 3 s epochs (approximately one panorama rotation, e.g., the individual green wedges in Fig. 5D,E), instead of averaging the response for the entire 10 s after a novelty transition as before. When analyzed on this finer temporal scale, wild-type flies show a sustained response to novelty for three to four successive rotations (∼9–12 s) of the competing images (Fig. 6B, right; and Fig. 5D,E in a sample fly). In contrast, when we looked at radish1 responses on this finer time resolution, we found that the mutant flies did indeed respond to novelty but that this image-locked response only lasted on average 3 s, or only one exposure of the competing objects (Fig. 6A, right). This confirms that radish mutants can see and discriminate the objects and suggests that the defect here lies not in the perception of visual stimuli but rather in the duration of perception before an internally generated switch occurs. Further confirming that the defect in this memory mutant is not at the level of simple visual processing, LFP responses to the same visual objects presented singly were not defective in radish mutants (Fig. 6C). Rather, it seems to be the introduction of salient visual competition that distracts the mutant sooner than wild type.
Brain recording paradigms: attention span
A central characteristic of attention is that it alternates among competing percepts at a characteristic tempo (Carter and Pettigrew, 2003; Brascamp et al., 2005). If the 20–30 Hz response to novelty reflects attention-like processes, then the abbreviated selective response to novelty in radish1 may be indicative of a shortened attention span in this mutant. Furthermore, if 20–30 Hz responses to visual stimuli do indeed describe an attention-like process, then these should be continuously alternating among competing percepts even without experimentally imposed novelty. To study this possibility, and with a view to better understand radish1 defects, we exposed flies to the same two distinct objects continuously, without novelty, while recording LFPs from their brains. We then applied some simple calculations to quantify alternation tempos in the brain LFP (supplemental Methods 2, available at www.jneurosci.org as supplemental material).
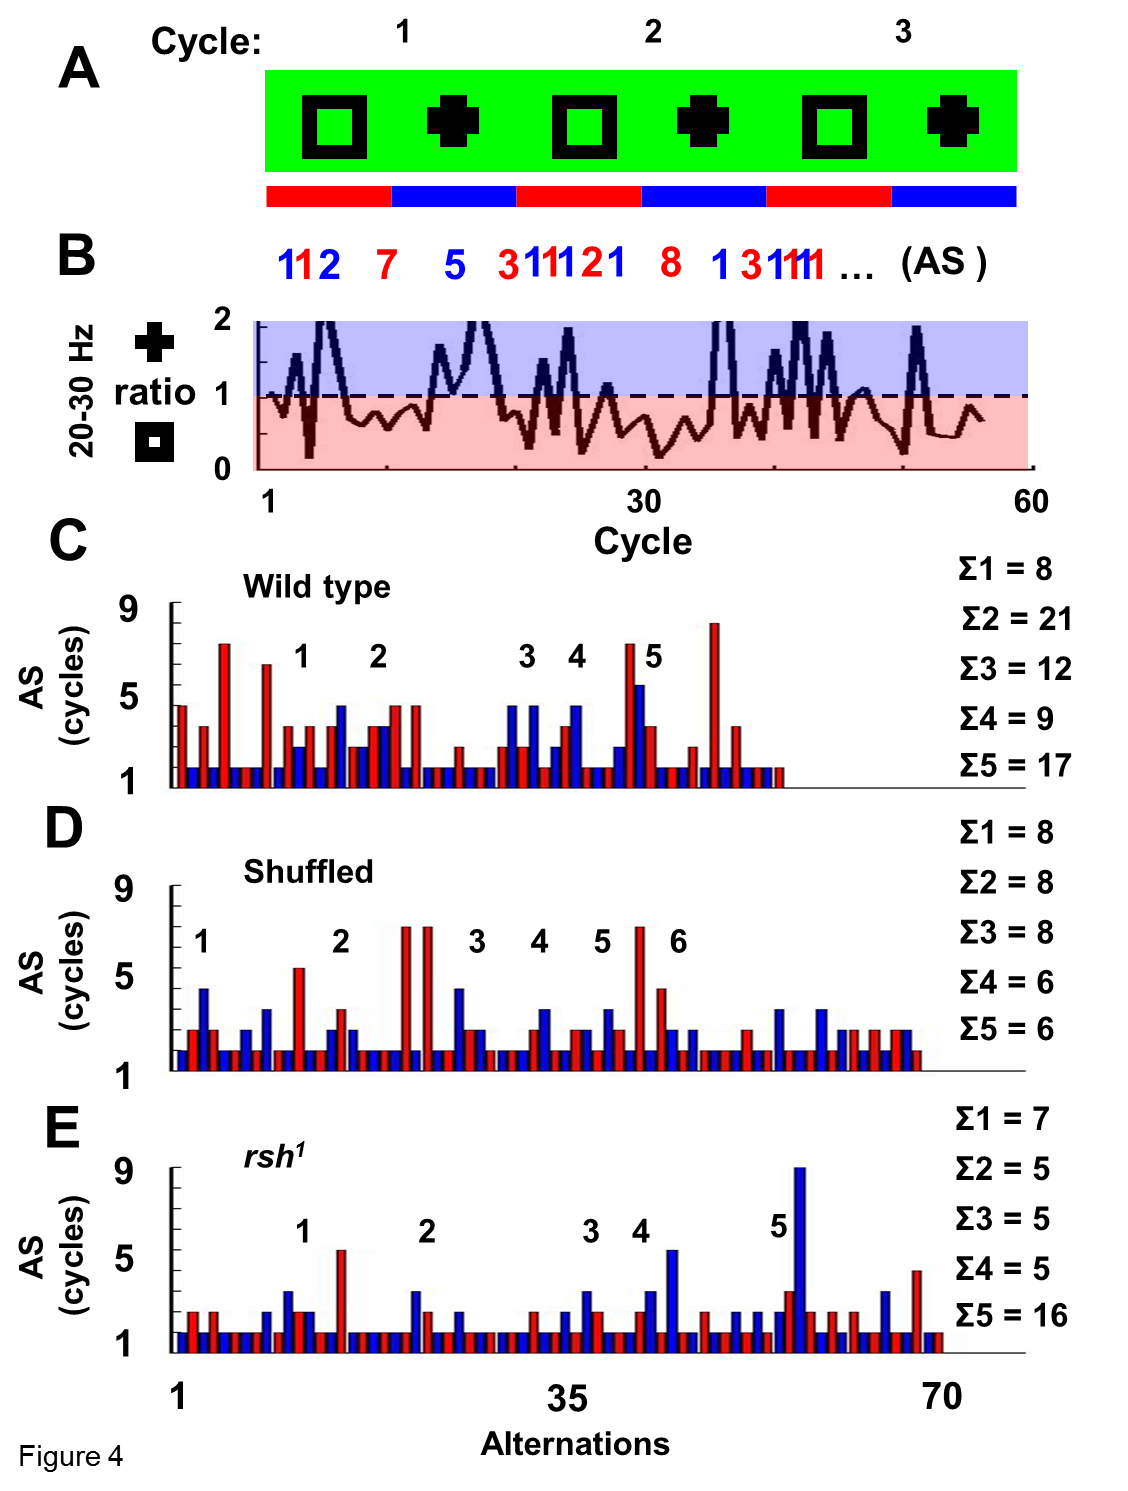
Wild-type flies and radish mutants were exposed to two objects in open loop (a square and a cross) simultaneously, as before (Fig. 5), but for extended epochs (400–800 s per fly) (Fig. 7). For each recording, 20–30 Hz power was summed for the consecutive 1.5 s periods when either object was in the frontal hemifield of the fly (Fig. 7A, black and gray bars). Thus, for every full 3 s rotation of the panorama, two 20–30 Hz values were calculated, one for either object. The log ratios of these two 20–30 Hz values are plotted for a sample wild-type fly in Figure 7B, for 60 successive cycles of the panorama rotation. The 20–30 Hz activity often appeared to alternate in power between objects: when power for one object was high, it was then low for the other object during that cycle (Fig. 7B). At times (or in the special case of salience relating to novelty, as above) such partitioning of 20–30 Hz power was biased toward one object for several successive cycles before alternating. Timings (in rotation cycles) between such alternations, termed here as AT (alteration time), were tallied (Fig. 7B, gray and black numbers) and visualized by a histogram (Fig. 7C, for the same sample fly). Noticing that wild-type AT data looked “clumped” (i.e., epochs when 20–30 Hz was biased to one or the other object for successive cycles; there are 5 such clumps in Fig. 7C) (supplemental Methods, available at www.jneurosci.org as supplemental material), we quantified this LFP bias (labeled Σ AT) in the fly brain activity by summing the duration (in total rotation cycles) of each AT clump (Fig. 7C, corresponding numbers in the right column). Combined data from eight wild-type flies revealed a frequency histogram with a characteristic shape resembling a gamma distribution (Fig. 8A).
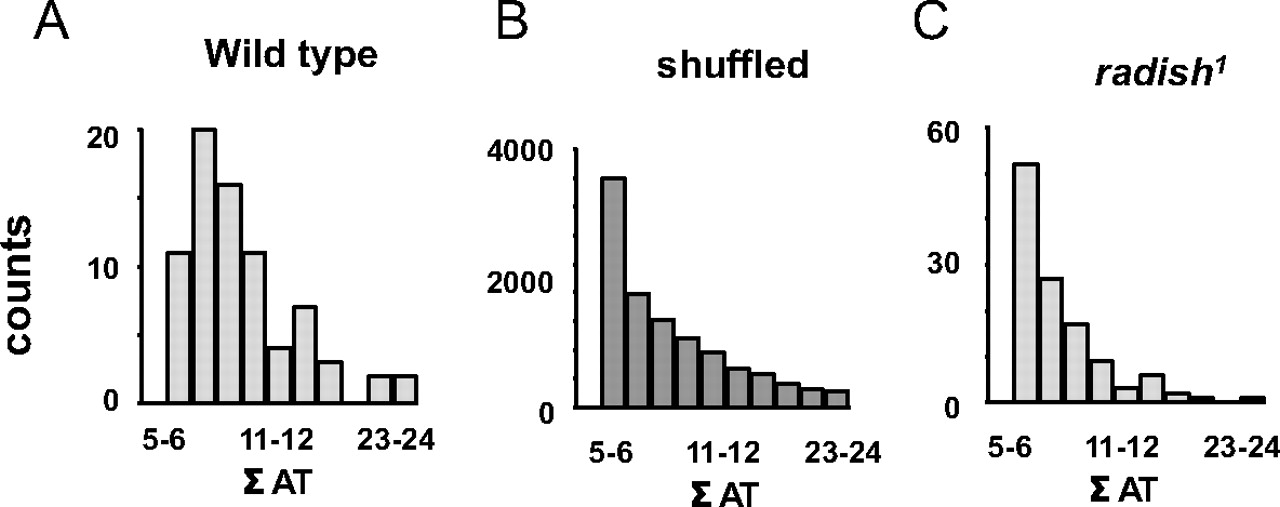
To determine the significance of this distribution of wild-type LFP alternation dynamics in response to two competing visual objects, we contrasted our experimental data to shuffled data derived from the same experiments. In this way, any temporal relation between 20–30 Hz values measured for successive cycles of image presentation would be lost. Shuffling of the data indeed revealed a loss of clumping, or fewer contiguous epochs of biased 20–30 Hz activity (Fig. 7D). Tallying this bias (Σ AT) by a frequency histogram revealed a significantly different distribution compared with nonshuffled data (p < 0.05, Kolmogorov–Smirnov test for distributions), which was more characteristic of a binomial distribution (Fig. 8B).
Finally, we applied the same methodology to radish1 and found that these mutants displayed brain LFP alternation statistics that were not significantly different from shuffled wild-type data (Figs. 7E, 8C) (p = 0.85 by the Kolmogorov–Smirnov test for distributions). This suggests that radish1 brain activity is alternating randomly between the two visual percepts (the cross and the square), without the sustained “attention” across successive cycles characteristic of wild-type flies. Curiously, heat-shock of hs–rsh(161) failed to rescue this alternation defect in radish mutants but did result in improved novelty detection (supplemental Fig. 5, available at www.jneurosci.org as supplemental material).
MPH effects
Given that we found a deficit in attention-like processes and a well defined behavioral hyperactivity in the radish mutant flies, we wondered whether drugs commonly used in humans to treat similar symptoms in perceptual timing and hyperactivity could also rescue analogous defects in flies. In humans, amphetamines are known to affect attention in a variety of ways, depending on dosage and the specific drug used. In previous studies, we have shown that methamphetamines can increase optomotor responsiveness (van Swinderen and Flores, 2007) as well as modulate LFP responses to visual stimuli (Andretic et al., 2005). Here, we asked specifically whether a related drug, MPH (“Ritalin”), could rescue radish1 defects in the optomotor maze and recording arena. MPH treatment, targeting the dopaminergic system (Iversen and Iversen, 2007), is typically administered to patients with attention deficit and hyperactivity disorder (ADHD). To first test the effect of MPH on wild-type flies, we fed starved animals 0.5 mg/ml of drug mixed in fly food. Testing in the optomotor maze after feeding resulted in an increased optomotor response, but this became significant only after 3 h since the initial feeding (Fig. 9A, 3 h). Such an increase in responsiveness is consistent with previous results for acute methamphetamine treatment in flies (van Swinderen and Flores, 2007) and also consistent with the time course of MPH treatment in humans (Pelham et al., 1999). A full day of chronic MPH exposure further increased the wild-type response (Fig. 9A, 24 h), although flies appeared to be slower and lethargic (data not shown). For this population exposed to a chronic treatment of MPH, only 1–2 h off the drug and onto regular food completely reset optomotor responsiveness to normal levels (Fig. 9A, Recovery), suggesting that effects on the brain were transient. We decided to focus on acute MPH treatment (2–4 h) to test for phenotypic rescue in radish mutants exposed to black/green gratings moving at 3 Hz (where radish1 showed no responsiveness). Remarkably, MPH treatment significantly increased radish1 optomotor performance from zero to wild-type levels (Fig. 9B, radish). When we explored the generality of this effect (increased optomotor responsiveness after drug treatment), we were surprised to find that acute MPH exposure did not alter optomotor responsiveness in a group of other learning and memory mutants (Fig. 9B), including amnesiac1, rutabaga2080, and dunce1.
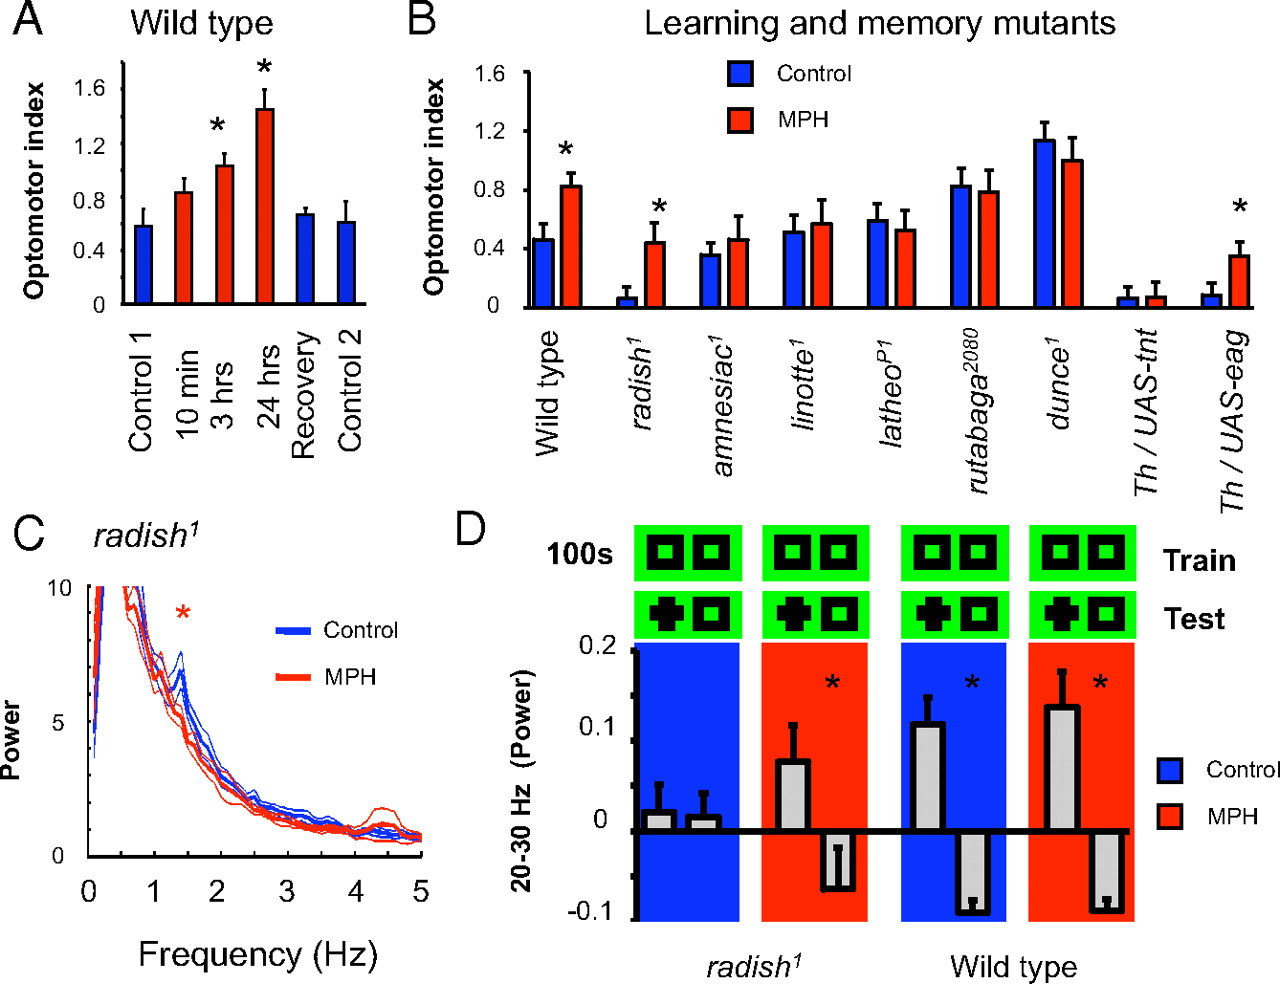
MPH is believed to affect dopamine signaling by targeting recycling of the neurotransmitter at the synapse (Iversen and Iversen, 2007). To test the involvement of dopamine in MPH-mediated optomotor effects, we treated two classes of flies with genetically altered dopamine function (Friggi-Grelin et al., 2003): Th–Gal4/UAS–tnt (in which dopaminergic neurons have been constitutively silenced) and Th–Gal4/UAS–eag [in which excitability of dopaminergic neurons was, in principle, increased (Broughton et al., 2004)]. Previous work has shown that either manipulation abolished optomotor responsiveness under our standard maze conditions, suggesting the requirement of a balanced dopamine environment for optomotor performance in the maze (van Swinderen and Flores, 2007). If MPH modulates dopamine levels in flies, then the presumed absence of dopamine in Th–Gal4/UAS–tnt mutants should block the effects of the drug. Indeed, the drug failed to rescue optomotor responsiveness in Th–Gal4/UAS–tnt flies (Fig. 9B). In contrast, Th–Gal4/UAS–eag flies, in which dopamine function is altered but presumably not absent, showed increased optomotor responsiveness after drug treatment, like wild type and radish1.
We proceeded to investigate brain responses in radish mutants treated with acute MPH. A spectral analysis of LFP activity in the brain revealed that the 1–2 Hz oscillation characteristic of radish mutants was gone in animals treated with the drug compared with the same animals before treatment (Fig. 9C) (supplemental Fig. 6, available at www.jneurosci.org as supplemental material) (n = 5; p < 0.05 by paired t test comparing the average 1.4–1.7 Hz frequency domain before and after treatment). We then addressed effects on selective attention more specifically by means of our visual competition paradigm (as in Fig. 7). MPH did not significantly change the ongoing attention span defect of radish mutants, with alternations still appearing random in our sample (supplemental Fig. 5, available at www.jneurosci.org as supplemental material). However, when we introduced novelty salience into this paradigm (as in Figs. 5, 6), MPH exposure improved the 20–30 Hz response in radish mutants by producing an increase in power assigned to the novel stimulus (selection) and a decrease in power to the non-novel stimulus (suppression), resembling wild-type responsiveness to visual novelty in both amplitude and temporal dynamics (Fig. 9D) (supplemental Fig. 6, available at www.jneurosci.org as supplemental material). Acute exposure to MPH in wild-type flies did not further increase the LFP effect (Fig. 9D).
Discussion
It is increasingly apparent that many classical Drosophila learning and memory mutants are also defective in short-term processes relevant to selective attention. Previous studies have shown that short-term memory as well as long-term memory mutants display attention-like defects (van Swinderen, 2007; van Swinderen et al., 2009), and the current study reveals radish mutants to be defective as well, albeit with distinctly different symptoms. The Drosophila mutants dunce1, rutabaga2080, and radish1 share olfactory memory defects but differ conspicuously for short-term processes relevant to visual attention. Whereas the more persistent optomotor behavior of dunce1 and rutabaga2080, both affecting the cAMP-associated pathways (Davis et al., 1995), are reminiscent of the persistent preoccupation of some patients afflicted with autism, the phenotype of radish mutant flies described here is similar to some of the symptoms of patients with ADHD.
The Drosophila radish gene encodes a protein required for ARM (Folkers et al., 1993, 2006). Without a functional form of this protein, flies are unable to preserve memories through cold-induced anesthesia. Originally described as a step to long-term memory formation in a cAMP pathway (Tully et al., 1994), radish has more recently been proposed to be involved in a distinct parallel network modulating long-term memory formation (Isabel et al., 2004). The proposed separation of radish circuits from cAMP-associated pathways to memory formation is consistent with our MPH results, in which none of the cAMP pathway mutants showed altered performance in the maze after drug treatment, whereas radish1 (and wild type) did. Because MPH is thought to target dopamine function in mammals (Iversen and Iversen, 2007), this suggests that dopaminergic modulation of attention-like phenotypes is blocked in mutants affecting cAMP signaling but not blocked in radish1. Interestingly, although representing a separate molecular network, radish appears to be strongly expressed in the MBs (Folkers et al., 2006), the same memory-associated structures expressing dunce, rutabaga, and other cAMP-related molecules (Davis, 2005). Our finding that MPH treatment does not improve optomotor behavior for mutants in which dopaminergic neurons have been silenced suggests that dopamine input to the MBs (Schwaerzel et al., 2003) is upstream of cAMP-signaling neurons in the MBs but parallel to radish-expressing neurons in the MBs. Our results therefore predict that radish and dunce effects involve different neuronal populations.
radish has been implicated in appetitive learning (Krashes and Waddell, 2008), so its role in memory formation is not necessarily restricted to ARM and may instead relate to more general attention-like processes. One intriguing possibility supported by results from our brain recording and behavioral experiments is that radish circuits might be involved in modulating the tempo of stimulus selection and suppression in the fly brain. We show in this study that radish mutants fail to respond to visual novelty for the typical three to four stimulus exposures, which are the number of exposures for a characteristic novelty response in wild-type flies in our paradigm (van Swinderen, 2007; van Swinderen et al., 2009). The radish mutant discriminates visual novelty by a characteristic selection/suppression response but only responds for one exposure. Perhaps as a consequence of such abbreviated perceptual selection, radish1 LFP alternations between competing visuals appear random over extended presentations. In contrast, wild-type flies displayed sustained biases in LFP responses, resulting in gamma-like distributions of response alternations. Such distribution shapes have also been observed in studies of perceptual rivalries in humans (Carter and Pettigrew, 2003). The significantly abbreviated temporal characteristics of radish1 responsiveness were reflected in two different behavioral paradigms: the optomotor maze and tethered flight. Together, our behavioral and electrophysiological results suggest that alternation processes in radish mutants are defective: whereas wild-type flies showed some persistence or hysteresis between alternations in behavior or brain activity, radish mutants alternated too quickly or even in an oscillatory manner when presented with competing visual stimuli. In contrast, at least behaviorally, dunce and rutabaga mutants exhibit an opposite phenotype; both display persistent choice behavior in the optomotor maze and both are less distracted by competing visuals than wild type (van Swinderen, 2007; van Swinderen et al., 2009).
Attaining the right balance between persistence and flexibility is a crucial feature of adaptive behavior, because it reflects the balance between exploration and exploitation of natural resources. It is tempting to speculate that radish and dunce/rutabaga may constitute the two respective extremes of this balance. Recent work investigating torque behavior of wild-type flies (similar to our shorter experiments here) has shown that, during extended flights, the occurrence of turning maneuvers can be described by a Lévi distribution (Maye et al., 2007). Such distributions of behavioral output, seen in foraging behavior in many animals, are characteristically long-tailed. This means that animals may occasionally persist with one behavioral choice for unusually long, but most often choices alternate at a more regular, normally distributed rate. The advantage of allowing for occasional long forays into one direction is presumably to chance on a new resource away from the proximal search space. Such behavior has been found to be ecologically advantageous, but mechanisms driving such alternation tendencies have not been documented in the Drosophila brain. One interpretation of our results is that the mushroom body circuits defined by dunce/rutabaga/radish expression are involved in establishing the balance between persistence and flexibility [i.e., the explore/exploit dilemma (Daw et al., 2006)]. A separate set of results has independently also arrived at a similar conclusion, suggesting that the mushroom bodies could be involved in maintaining a period of behavioral flexibility (i.e., attention-like processes) before a longer-term transition to habit formation or motor learning (Brembs, 2009).
The most intriguing open question following from our results is how the divergent attention-like effects in the classical learning mutants can be related to their converging memory defects. Of course, there may not be a connection at all. The common learning phenotype is restricted to classical olfactory learning; in visual learning, radish1 appears to perform reasonably well, whereas dunce and rutabaga mutants fail (Gong et al., 1998; Brembs and Plendl, 2008). Moreover, the olfactory memory phenotypes of these mutants are rescued acutely (McGuire et al., 2003; Folkers et al., 2006), whereas the short-term defects described here and elsewhere (van Swinderen, 2007; van Swinderen et al., 2009) can only be rescued by expressing the wild-type gene during development and not in the adult. Surprisingly, our MPH results suggest that some of these short-term deficiencies (most likely caused by developmental defects in the brain) can be acutely compensated via alternate pathways modulating dopamine function.
Although distinct functions at this point cannot be excluded, it nevertheless remains tantalizing to find attention-like defects in every Drosophila memory mutant investigated so far: dunce1 and rutabaga2080 (van Swinderen, 2007), long-term memory mutants (van Swinderen et al., 2009), and radish1 (this study). This may not be surprising: early studies already pointed to habituation and sensitization defects in some of these mutants (Duerr and Quinn, 1982), which may relate to the attention-like phenotypes of our study. We suggest that radish1 may be defective in memory consolidation because of a previously overlooked defect in tempo of attention-like alternations. Reduced hysteresis in brain activity and behavior in the radish mutant, often amounting to random choice behavior, and especially a 1–2 Hz oscillation in brain activity and behavior, might interfere with the reconstitution of stereotypical patterns of neural activity representing a memory after anesthesia. Rather than calling for a reevaluation of the role of radish in memory formation, these results strengthen the view that ARM circuits act as a gating mechanism for memory formation (Isabel et al., 2004). By periodically changing perception from one stimulus to the next, attention mechanisms would thus play a role in gating memory formation. One challenge now is to understand how suppression mechanisms, modulated by dunce/rutabaga circuits (van Swinderen, 2007), interact with the temporal mechanisms modulated by radish (this study) to control attention processes, action selection, and eventual memory formation.
Footnotes
- Received September 11, 2009.
- Revision received November 17, 2009.
- Accepted November 18, 2009.
-
This material is based on work supported by National Science Foundation Grant 052326 (B.v.S.) and Deutsche Forschungsgemeinschaft Grant BR 1892/3-1 (B.B.). We thank Angelique Paulk for helpful comments on this manuscript and Diana Pauly, Oliver Evans, and Thomas Pollak for help with the behavioral assays.
- Correspondence should be addressed to Bruno van Swinderen, Queensland Brain Institute, The University of Queensland, Brisbane, Queensland 4072, Australia. b.vanswinderen@uq.edu.au
- Copyright © 2010 the authors 0270-6474/10/301003-12$15.00/0